미세먼지 논문 심사를 받는 과정에서 파이퍼 다이어그램(Piper diagram)으로 이온 자료를 해석하라는 요구를 받았습니다.
그래프 소프트웨어(SigmaPlot, Origin Pro, Grapher)로 쉽게 작성할 수 있습니다. 물론 R과 Python으로도 작성할 수 있는데 그래프 전문 소프트웨어가 편합니다.
SigmaPlot의 기본 그래프 옵션에는 보이지 않습니다. Ternary diagram만 보입니다.

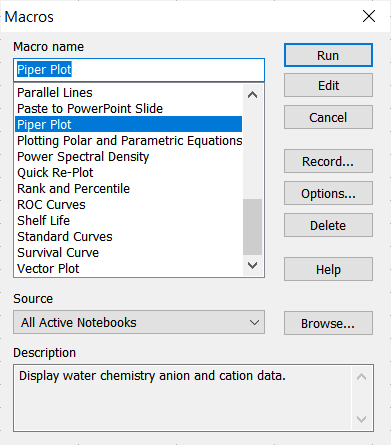
ToolBox에서 Macros를 클릭하고, Piper Plot을 선택합니다.


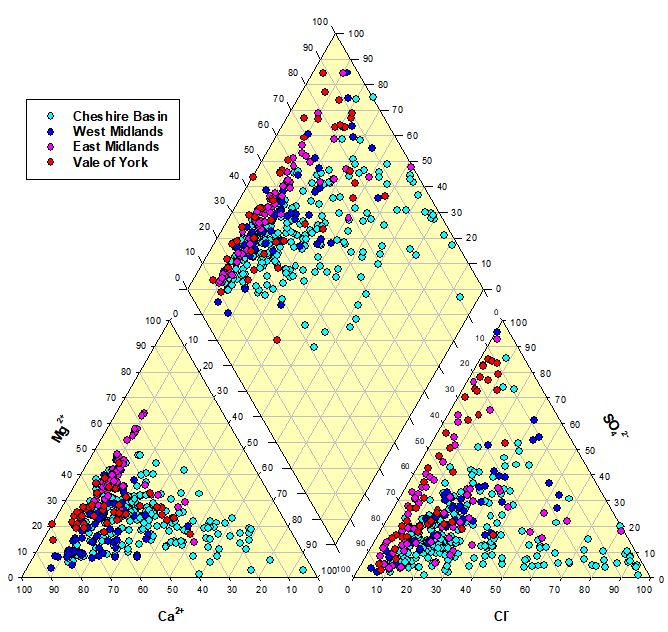
SigmaPlot의 파이퍼 다이어그램 예시입니다.

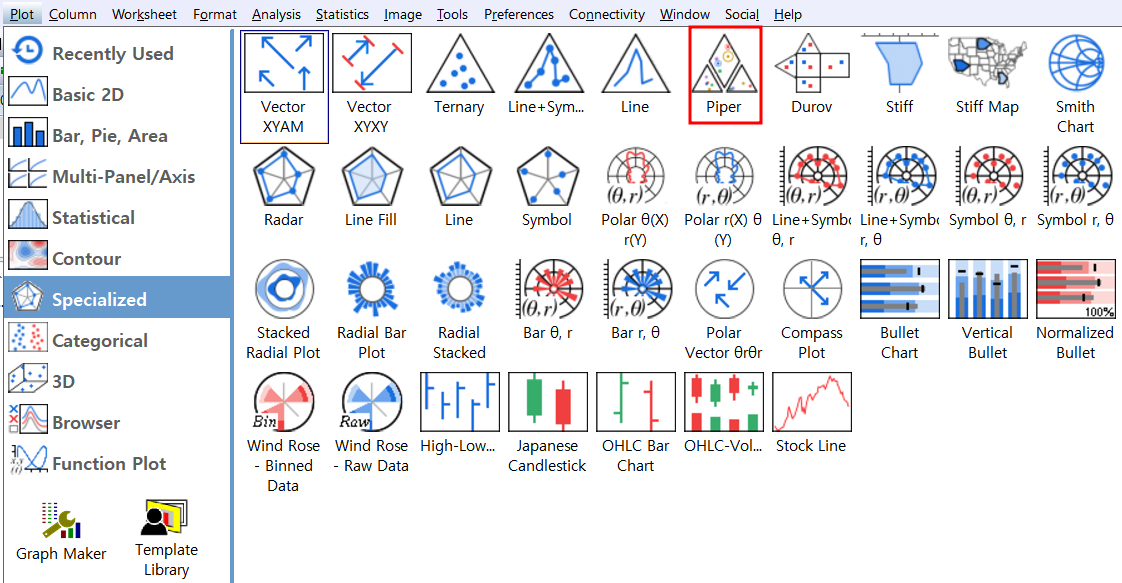
Origin Pro에서는 Plot 메뉴에 Piper가 바로 보입니다.

Help Online - Tutorials - Piper Diagram (originlab.com)
Help Online - Tutorials - Piper Diagram
www.originlab.com
파이퍼 다이어그램에 관한 상세한 설명(자료 해석 방법)은 아래 두 링크를 참고하세요.
What is a Piper diagram for water chemistry analysis and how to create one? — Hatari Labs
What is a Piper diagram for water chemistry analysis and how to create one? — Hatari Labs
In 1994, Arthur M. Piper, proposed an effective graphic procedure to segregate relevant analytical data to understand the sources of the dissolved constituents in water. This procedure was born under the statement that most natural waters contain cations a
hatarilabs.com
What is a piper plot (trilinear diagram)? – Golden Software Support
What is a piper plot (trilinear diagram)?
In the fields of hydrogeology and groundwater analysis, piper plots (also known as trilinear diagrams) are very powerful tools for visualizing the relative abundance of common ions in water samples...
support.goldensoftware.com
'자료처리' 카테고리의 다른 글
| 수동대기채취 지점별 시료채취율 산정 (0) | 2022.10.18 |
|---|---|
| R과 Origin Pro를 이용한 주성분 분석(PCA) (0) | 2022.10.01 |
| R 패키지 ggThemeAssist로 ggplot2 그래프 쉽게 수정하기 (0) | 2022.09.12 |
| 파이썬 라이브러리(matplotlib) 설치 (0) | 2022.04.23 |
| R & MATLAB 산점도에 날짜 컬러바(color bar) 추가하기 (0) | 2022.04.18 |


댓글