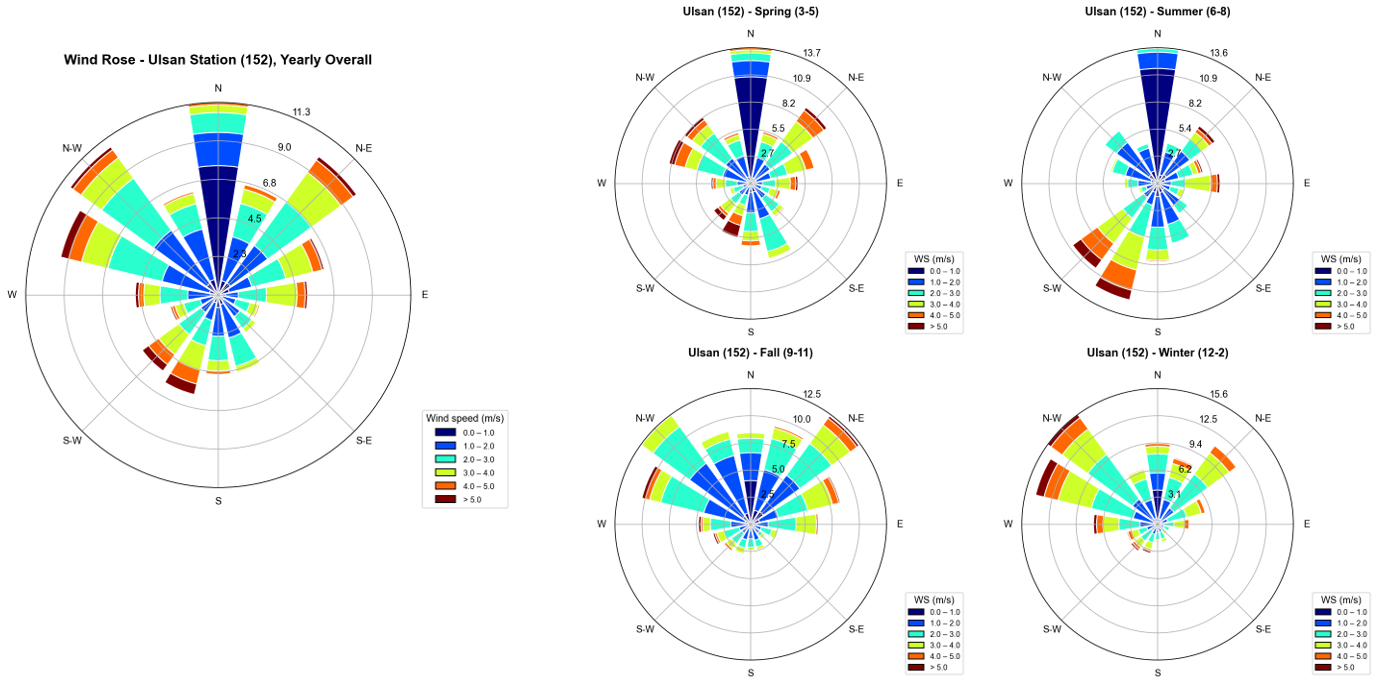
대기오염 수업시간에 예시로 보여줄 바람장미 파이썬 코드입니다.
기본 코드는 Claude로 작성했고, Spyder로 표출할 때 생기는 오류 수정 등은 Gemini를 사용했습니다. 이후 세부적인 수정은 Spyder에서 직접했습니다.
기상청에서 입수한 2024년 울산 기상자료입니다.
OBS_ASOS_TIM_20250917112548.csv
0.90MB
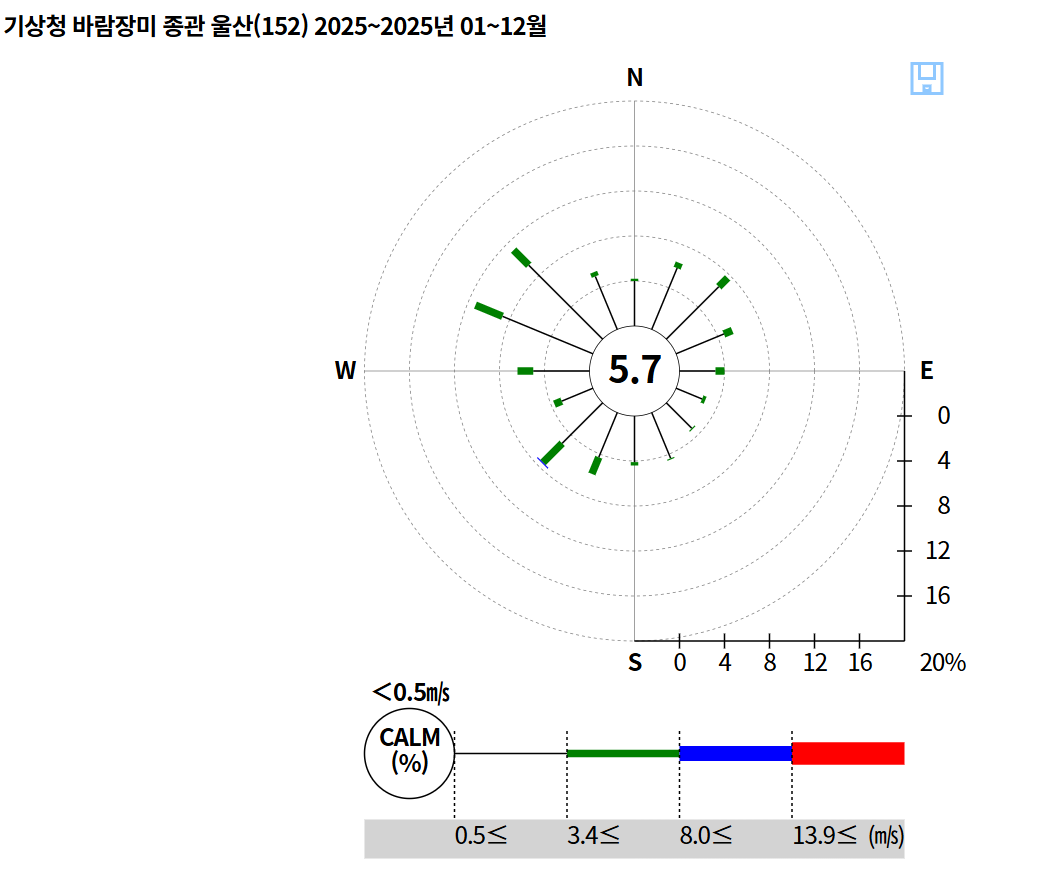
기상청 바람장비와 잘 맞습니다. 기상자료개방포털[기후통계분석:계급별일수:바람 계급별일수(바람장미)]
import pandas as pd
import matplotlib.pyplot as plt
from windrose import WindroseAxes


plt.rcParams['font.family'] = 'Arial'

# 1. 자료 불러오기 및 데이터 전처리
file_path = r'C:\Users\ 본인 파일 경로 \OBS_ASOS_TIM_20250917112548.csv' # 기상청 1년 자료
df = pd.read_csv(file_path, encoding='cp949')

data = df[['일시', '풍속(m/s)', '풍향(16방위)']].dropna().copy()
data['풍속(m/s)'] = data['풍속(m/s)'].astype(float)
data['풍향(16방위)'] = data['풍향(16방위)'].astype(float)

# 날짜 변환 및 계절 구분
data['일시'] = pd.to_datetime(data['일시'])
month = data['일시'].dt.month

def get_season(m):
    if m in [3, 4, 5]:
        return 'Spring (3-5)'
    elif m in [6, 7, 8]:
        return 'Summer (6-8)'
    elif m in [9, 10, 11]:
        return 'Fall (9-11)'
    else:
        return 'Winter (12-2)'

data['계절'] = month.apply(get_season)
# bins_range = [0, 1, 2, 3, 4, 5, 6, 7, 8, 9]
bins_range = [0, 1, 2, 3, 4, 5]


# -------------------------------------------------------------
# ★ 범례 텍스트 커스텀 변환 함수 (대괄호 제거 및 en-dash 변경)
# -------------------------------------------------------------
def fix_legend_labels(legend):
    for text in legend.get_texts():
        t = text.get_text()
        t = t.replace('[', '').replace(')', '').replace(']', '')
        t = t.replace(':', '–')
        # '>' 기호 바로 뒤에 공백 추가 (예: '>9.0' -> '> 9.0')
        t = t.replace('>', '> ')
        text.set_text(t)


# ==========================================
# [그림 1] 1년 전체 바람장미 (단독 창)
# ==========================================
fig1 = plt.figure(figsize=(8, 7))
ax1 = fig1.add_subplot(1, 1, 1, projection='windrose')

ax1.bar(
    data['풍향(16방위)'], data['풍속(m/s)'],
    normed=True,
    opening=0.8,
    edgecolor='white',
    bins=bins_range,
    cmap=plt.cm.jet
)
ax1.set_title('Wind Rose - Ulsan Station (152), Yearly Overall', fontsize=14, pad=20, fontweight='bold')

# 범례 생성 후 텍스트 수정 적용
leg1 = ax1.set_legend(
    title='Wind speed (m/s)',
    loc='lower right',
    bbox_to_anchor=(1.25, -0.05)
)
fix_legend_labels(leg1)


# ==========================================
# [그림 2] 계절별 바람장미 (2x2 배열)
# ==========================================
fig2 = plt.figure(figsize=(12, 10))

seasons_list = [
    ('Spring (3-5)', data[data['계절'] == 'Spring (3-5)']),
    ('Summer (6-8)', data[data['계절'] == 'Summer (6-8)']),
    ('Fall (9-11)', data[data['계절'] == 'Fall (9-11)']),
    ('Winter (12-2)', data[data['계절'] == 'Winter (12-2)'])
]

for idx, (season_name, s_data) in enumerate(seasons_list, 1):
    ax2 = fig2.add_subplot(2, 2, idx, projection='windrose')

    ax2.bar(
        s_data['풍향(16방위)'], s_data['풍속(m/s)'],
        normed=True,
        opening=0.8,
        edgecolor='white',
        bins=bins_range,
        cmap=plt.cm.jet
    )
    ax2.set_title(f'Ulsan (152) - {season_name}', fontsize=12, pad=15, fontweight='bold')

    # 범례 생성 후 텍스트 수정 적용
    leg2 = ax2.set_legend(
        title='WS (m/s)',
        loc='lower right',
        bbox_to_anchor=(1.28, -0.05),
        fontsize=8
    )
    fix_legend_labels(leg2)

fig2.tight_layout()

# 5. 그림 출력
plt.show()
'자료처리' 카테고리의 다른 글
| 주요 AI 거대언어모델(LLM) 비교 (0) | 2026.06.03 |
|---|---|
| DNN/ANN 모델에서 데이터 분할과 검증 (0) | 2026.05.29 |
| Openair 패키지 3.0 버전 업데이트 주의 사항 (0) | 2026.04.26 |
| R shiny를 이용한 울산 대기오염 대시보드 작성 (0) | 2026.04.24 |
| R과 파이썬으로 농도가중역궤적(CWT) 그리기 (0) | 2026.01.27 |


댓글