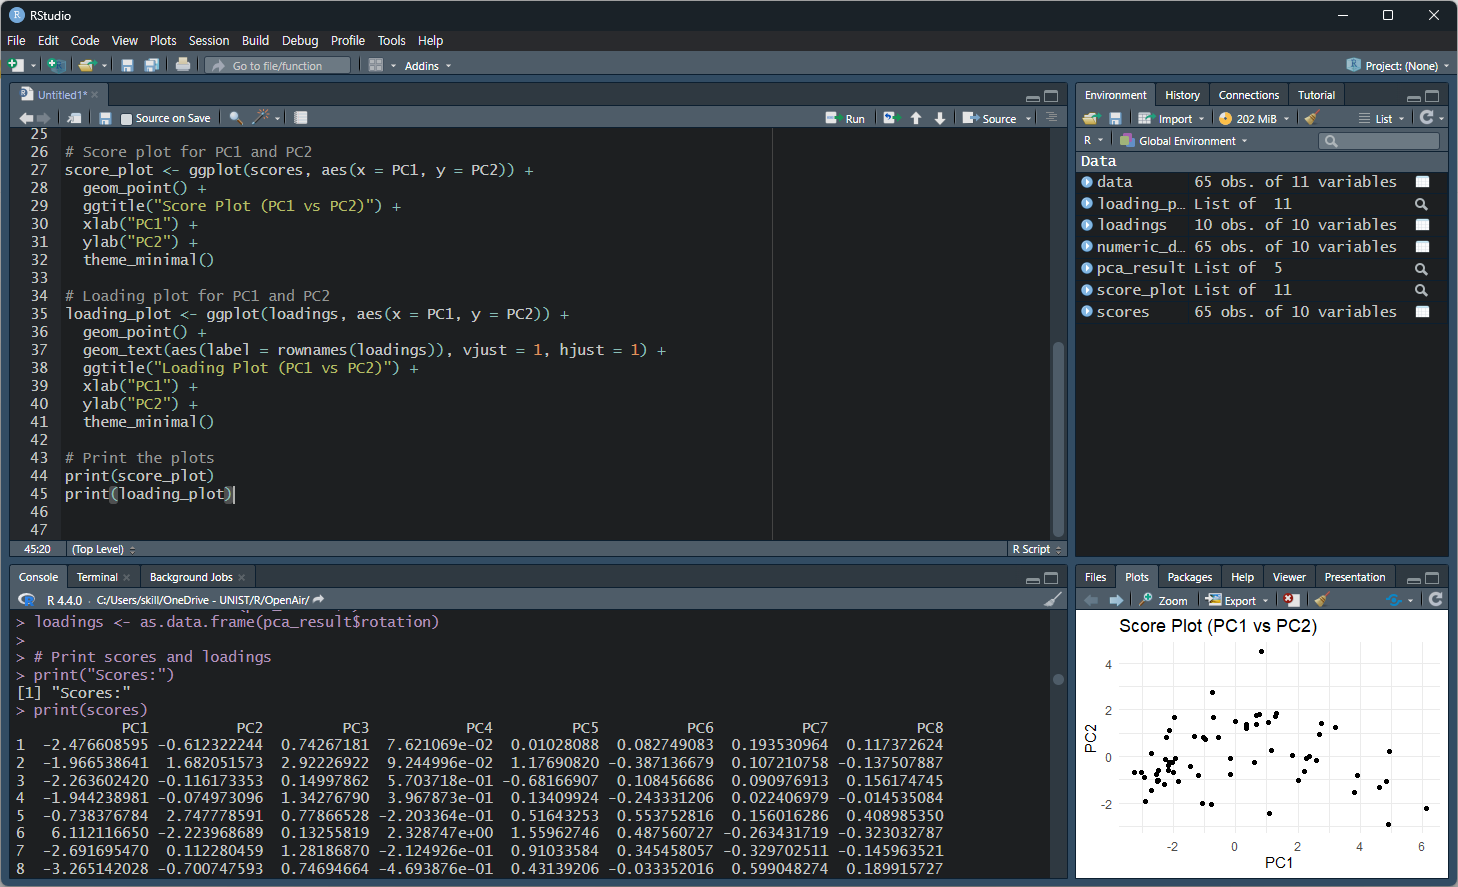
다음 코드를 이용하여 R에서 주성분 분석을 수행할 수 있습니다.
코드가 길어 보이지만 대부분 그림 그리는 내용이고, 실제로 PCA는 딱 한 줄로 실행됩니다.
pca_result <- prcomp(numeric_data, scale. = TRUE, center = TRUE,)
R 기본 패키지(stats)에 PCA 함수인 princomp와 prcomp가 있는데, prcomp를 사용하세요.
# Load necessary libraries
library(ggplot2)
library(readr)
library(dplyr)

# Read the data
data <- read_csv("C:/Users/skill/Desktop/PCA 프로필.csv")

# Convert all columns to numeric, if they are not already
numeric_data <- data %>%
  select_if(is.numeric)

# Perform PCA
pca_result <- prcomp(numeric_data, scale. = TRUE, center = TRUE,)

# Extract scores and loadings
scores <- as.data.frame(pca_result$x)
loadings <- as.data.frame(pca_result$rotation)

# Print scores and loadings
print("Scores:")
print(scores)
print("Loadings:")
print(loadings)

# Score plot for PC1 and PC2
score_plot <- ggplot(scores, aes(x = PC1, y = PC2)) +
  geom_point() +
  ggtitle("Score Plot (PC1 vs PC2)") +
  xlab("PC1") +
  ylab("PC2") +
  theme_minimal()

# Loading plot for PC1 and PC2
loading_plot <- ggplot(loadings, aes(x = PC1, y = PC2)) +
  geom_point() +
  geom_text(aes(label = rownames(loadings)), vjust = 1, hjust = 1) +
  ggtitle("Loading Plot (PC1 vs PC2)") +
  xlab("PC1") +
  ylab("PC2") +
  theme_minimal()

# Print the plots
print(score_plot)
print(loading_plot)
그림을 다시 그리려면 적재값과 점수를 csv 파일로 출력하는 코드만 추가하면 됩니다.
저는 R을 다른 소프트웨어 PCA 결과와 비교하는 용도로 사용하고, 실제 연구에는 별로 사용하지 않습니다. POPs나 PAHs 자료는 빅데이터가 아니라서 보통 SPSS나 OriginPro를 사용해서 PCA를 수행합니다.
'자료처리' 카테고리의 다른 글
| 주요 통계 소프트웨어 정리 (0) | 2024.07.01 |
|---|---|
| Python 주성분 분석 (0) | 2024.07.01 |
| Orange Data Mining을 이용한 주성분 분석과 군집분석 (0) | 2024.07.01 |
| SigmaPlot 주성분 분석 (0) | 2024.07.01 |
| OriginPro 주성분 분석 (0) | 2024.07.01 |


댓글